
The trade-off between flexibility and interpretability
Every model choice trades flexibility against interpretability: the more complex the patterns a model can fit, the harder it is to see how it reaches a decision. Here is that trade-off, method by method, with a credit risk model as the running example.
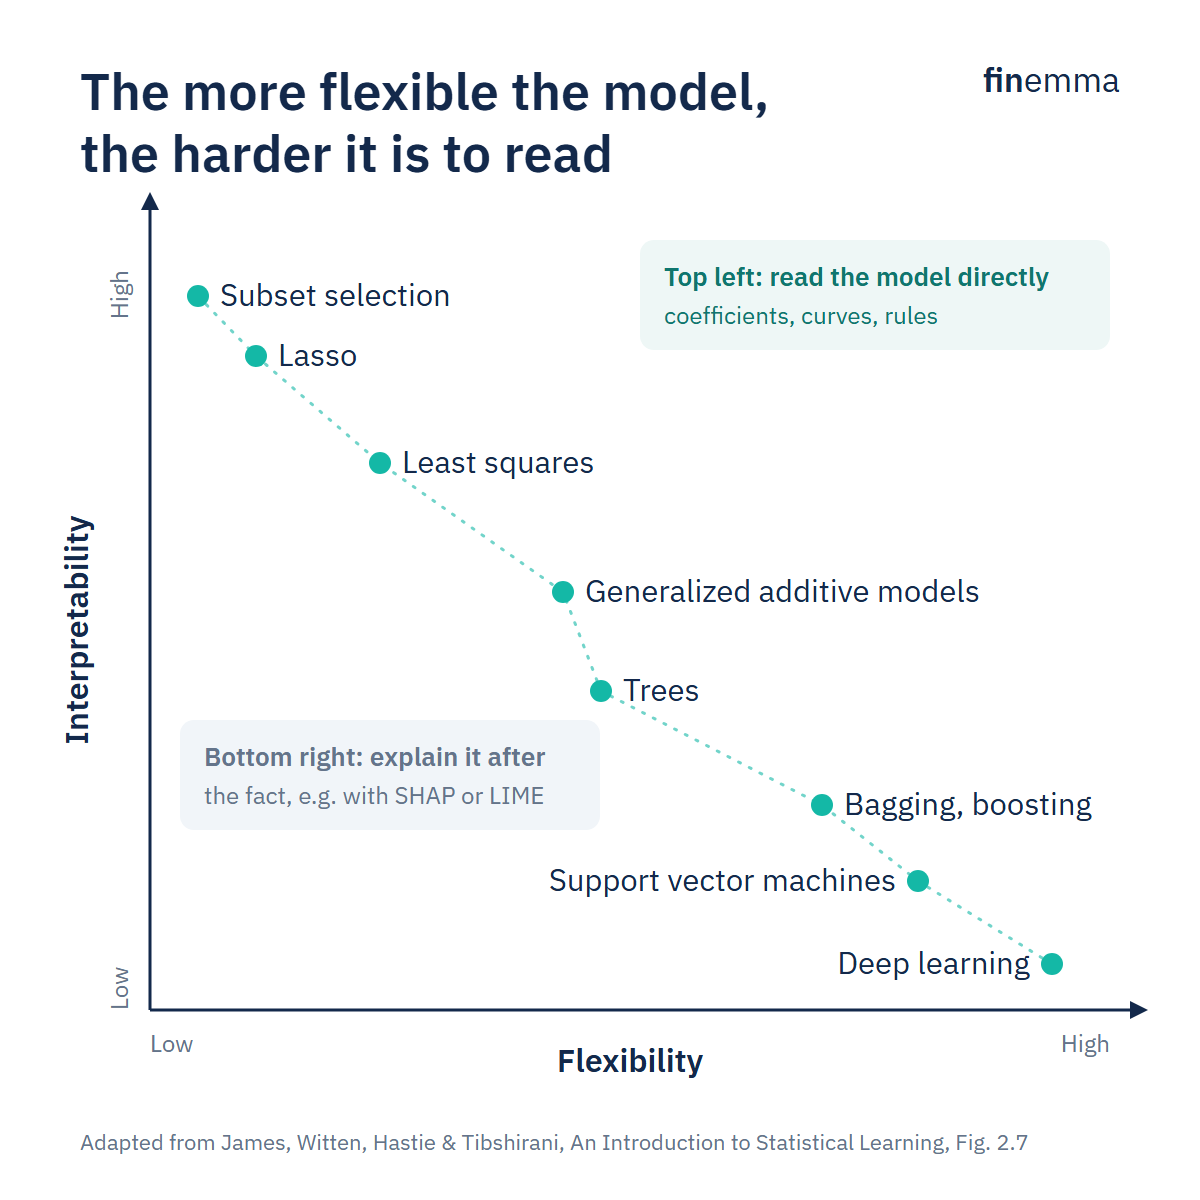
See the chart: the flexibility and interpretability of eight common methods
The ladder
In An Introduction to Statistical Learning, James, Witten, Hastie and Tibshirani rank common methods from most interpretable (and least flexible) to most flexible (and least interpretable):
- Subset selection
- Lasso
- Least squares
- Generalized additive models
- Trees
- Bagging and boosting
- Support vector machines
- Deep learning
The ranking is a rule of thumb, not a law, but it is a useful map. Imagine a lender predicting the probability that a borrower defaults.
Sparse linear models: subset selection and the lasso
Subset selection keeps the few variables that predict best and drops the rest. The lasso does something similar automatically: it shrinks coefficients, and pushes the least useful ones to exactly zero. The result might use only debt-to-income, payment history and credit utilisation. Each variable has one coefficient, with a sign and a size you can explain to a risk committee or a regulator.
Least squares
Ordinary least squares, or logistic regression for a default/no default outcome, keeps every variable. The model is still linear, so each effect is still one number. But with dozens of inputs, many of them correlated (income, debt and utilisation move together), individual coefficients become unstable and harder to interpret.
Generalized additive models
A GAM keeps the additive structure but lets each variable have a curved effect. Default risk can rise slowly with debt-to-income and then sharply past a threshold. Each curve can be plotted and checked, so the model remains readable: you look at a few charts instead of a few numbers.
Trees
A decision tree splits the data into rules: "utilisation above 80% and two or more late payments: high risk". A small tree is easy to read, which is why trees are popular with business users. But trees are unstable: a slightly different sample can produce a different tree, and deep trees stop being readable.
Bagging and boosting
Random forests (bagging) and gradient boosting combine hundreds of trees. On tabular data such as credit files they are often among the most accurate methods. The price is that no single rule explains a prediction any more; explanations have to be estimated after the fact, for example with SHAP values.
Support vector machines and deep learning
Support vector machines with non-linear kernels, and deep neural networks, can fit very complex patterns: interactions between many variables, text, images, order book data. They are the hardest to interpret. In finance, they earn their place mostly where the data itself is complex and plentiful, such as text or high-frequency data.
What the ladder does not say
More flexible is not automatically more accurate. Flexibility reduces bias but increases variance. Financial data has a low signal-to-noise ratio and changes regime over time, so flexible models can fit noise that will not repeat. A lasso can beat a deep network out of sample.
The trade-off is not fixed. Research on interpretable models, notably by Cynthia Rudin, shows that a carefully designed interpretable model can sometimes match the accuracy of a black box. Leo Breiman's classic essay on "two cultures" of statistical modelling describes the same tension from the other side: why flexible algorithmic models often win on prediction.
A practical rule
- Start at the top of the ladder with a sparse linear model as the baseline.
- Move down one step only if it clearly improves results on data the model has never seen, after costs, and across market regimes.
- When you move to a black box, plan from day one how you will explain and monitor it.
References
- Gareth James, Daniela Witten, Trevor Hastie and Robert Tibshirani, An Introduction to Statistical Learning, 2nd edition, 2021 (Section 2.1.3, on the trade-off between prediction accuracy and model interpretability).
- Robert Tibshirani, Regression Shrinkage and Selection via the Lasso, Journal of the Royal Statistical Society, Series B, 1996.
- Trevor Hastie and Robert Tibshirani, Generalized Additive Models, Statistical Science, 1986.
- Leo Breiman, Statistical Modeling: The Two Cultures, Statistical Science, 2001.
- Cynthia Rudin, Stop Explaining Black Box Machine Learning Models for High Stakes Decisions and Use Interpretable Models Instead, Nature Machine Intelligence, 2019.
- Christoph Molnar, Interpretable Machine Learning.